Verified: 2026-11
Aral Sea before and after in photos
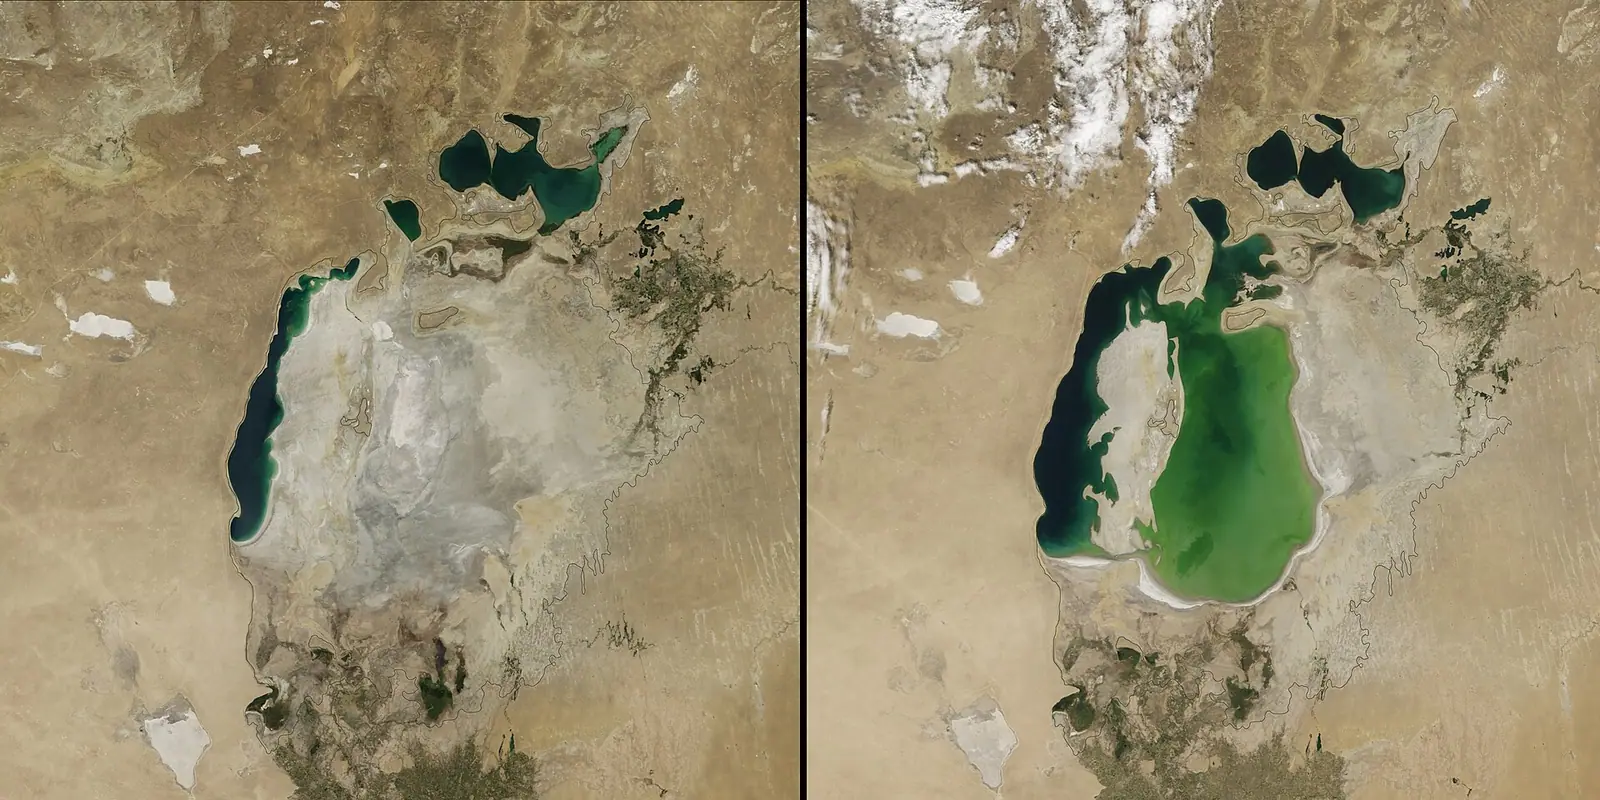
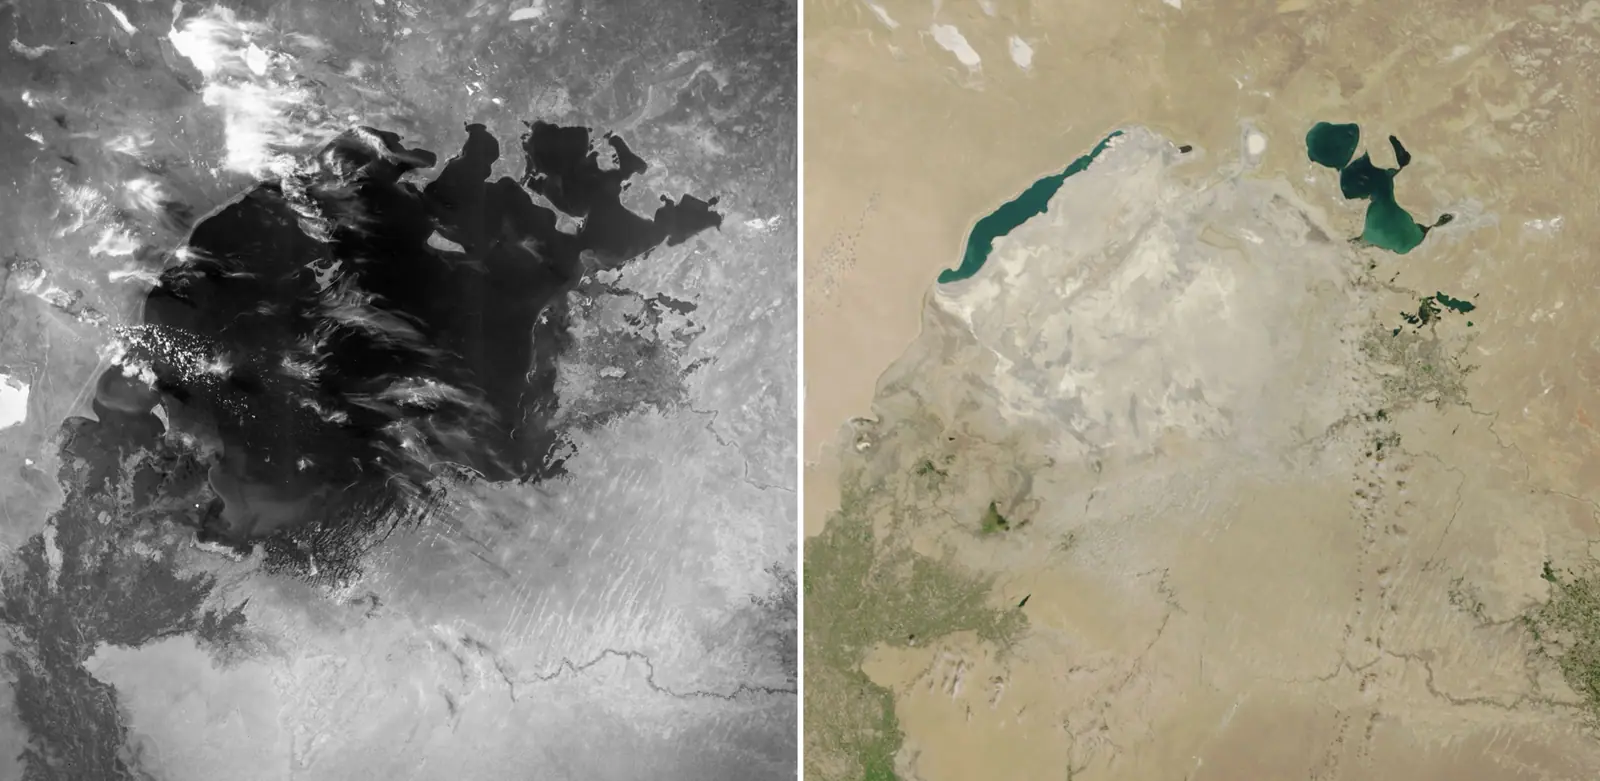
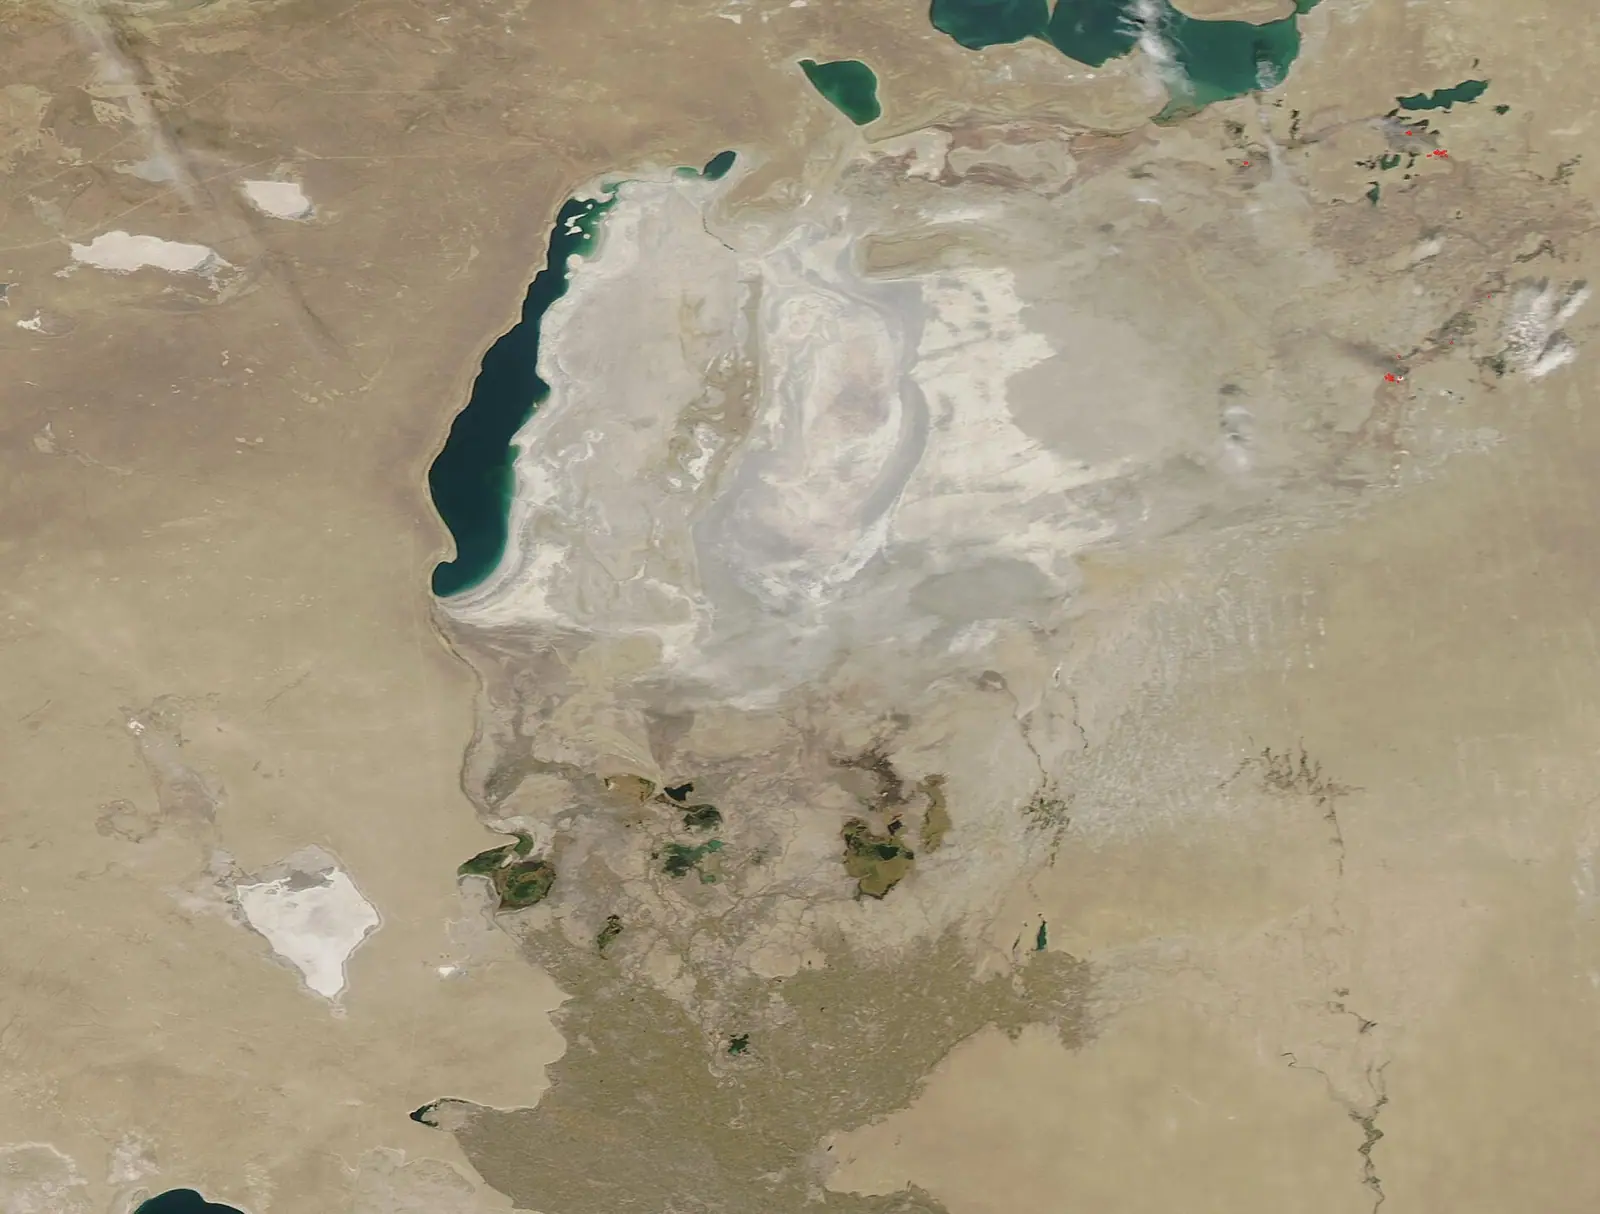
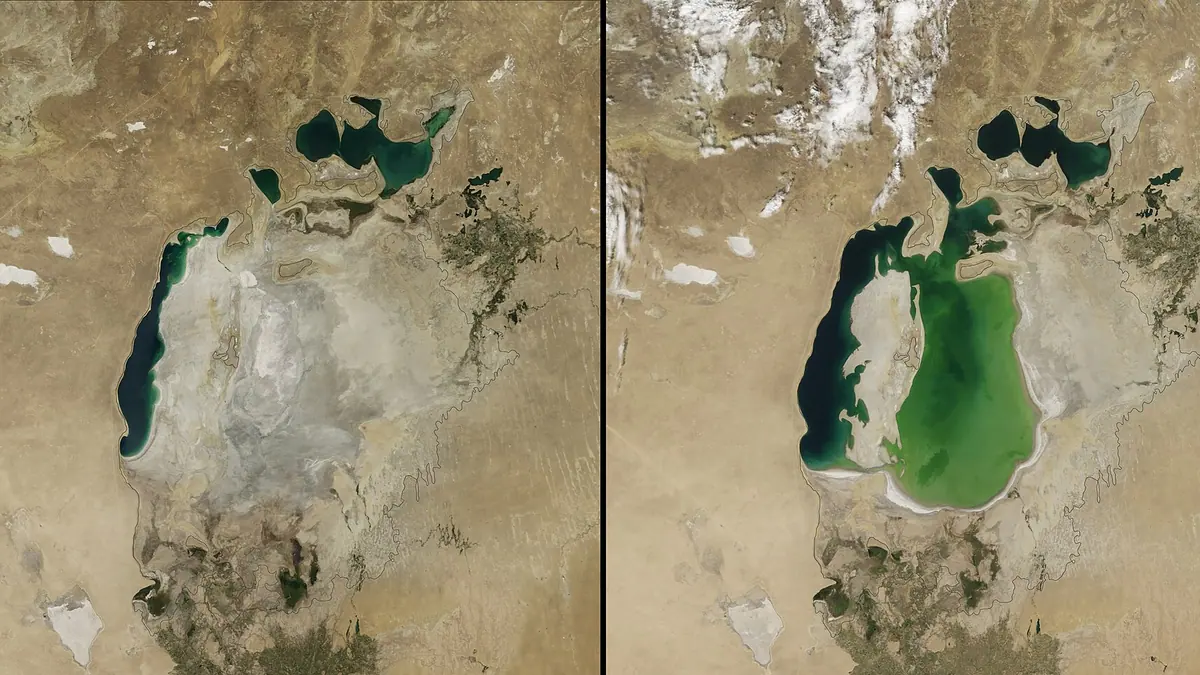
Real photos by travellers (Pexels, Unsplash, Wikimedia Commons); author and licence are given in each caption.
The Aral Sea before and after comes down to two pairs of numbers: 67,499 km² and 1,089 km³ of water in 1960, then 8,409 km² and 84 km³ in 2009. That is 87.5% of the surface and 92.3% of the volume gone in 49 years. The northern part, in Kazakhstan, holds 23.4 km³ today, or 2.1% of what the whole sea held.
Micklin 2010 via Conrad, Kobildjanova
The bars show the surface shrinking faster with each period, right up to the last data point. If you quote these figures, keep the year and the author with them, because estimates for the same year differ.
Aral Sea before and after: area and volume by year
These five points are Philip Micklin’s series as reproduced by Conrad and Kobildjanova. We added the percentages and the yearly rates, which divide the change between two rows by the years between them.
| Year | Area, km² | Of 1960 | Volume, km³ | Of 1960 | Area lost per year, km² | Volume lost per year, km³ |
|---|---|---|---|---|---|---|
| 1960 | 67,499 | 100% | 1,089 | 100% | — | — |
| 1971 | 60,200 | 89.2% | 925 | 84.9% | 664 | 14.9 |
| 1976 | 55,700 | 82.5% | 763 | 70.1% | 900 | 32.4 |
| 1989 | 39,734 | 58.9% | 364 | 33.4% | 1,228 | 30.7 |
| 2009 | 8,409 | 12.5% | 84 | 7.7% | 1,566 | 14 |
How to read it: figures combine all parts of the sea, and each rate is the average for the period ending in that row. Surface area fell fastest in 1989–2009, at 1,566 km² a year. Volume fell fastest in 1971–1976, at 32.4 km³ a year. So the period of the largest area loss and the period of the largest water loss are different.
NASA and the authors in Applied Water Science give the same cause: river water was taken for irrigation. Inflow dropped from 42 km³ in 1960 to 4.5 km³ in 2010, which is 10.7% of the earlier flow, and it came close to zero in some years (0.2 km³ in 1977).
Aral Sea today: the North and South have split paths
The North Aral ended 2010 with almost the same volume as in 1987, while the South lost most of its water. The northern basin held 22.4 km³ in 1987 and 22.6 km³ in 2010, ranging from 17.9 to 27 km³ in between. The southern basin fell from 323.2 to 75.5 km³, a 77% drop.
| Year | River inflow, km³ | North Aral, km³ | South Aral, km³ | Whole sea, km³ | Salinity, g/L |
|---|---|---|---|---|---|
| 1960 | 42 | — | — | 1,093 | 10 |
| 1977 | 0.2 | — | — | 749.2 | 15.4 |
| 1987 | 1 | 22.4 | 323.2 | 345.6 | 25 |
| 1998 | 31.5 | 27 | 168.4 | 195.4 | 42 |
| 2005 | 7.4 | 22.5 | 89.8 | 112.3 | 98 |
| 2010 | 4.5 | 22.6 | 75.5 | 98.1 | 130 |
How to read it: volume in km³, salinity in grams per litre, from Gaybullaev, Chen and Gaybullaev. A dash means the authors give no separate value for that year. Salinity rose 13-fold, from 10 to 130 g/L.
Kazakhstan water ministry via Kapital.kz, Zakon.kz
Kazakhstan’s Ministry of Water Resources and Irrigation reports growth from 18.9 km³ in early 2022 to 23.4 km³ in August 2026. In February 2025 the northern sea covered 3,065 km², up 111 km² from early 2022. That equals 4.5% of the 1960 surface of the whole sea. The August 2026 figure is below the September 2025 one, so the series does not climb in a straight line. Compare dates, not only the first and last points.
Where Aral Sea figures disagree
Authors use different methods and dates, so gaps are normal. Pick one source for a comparison and name it.
| Measure | Value 1 | Value 2 | Note |
|---|---|---|---|
| Volume, 1960 | 1,089 km³, Micklin | 1,093 km³, Gaybullaev et al. | small gap |
| Volume, 2009 | 84 km³, Micklin | 102 km³, Gaybullaev et al. | 18 km³ apart |
| North Aral | 24.1 km³, Sept 2025, ministry | 23.4 km³, Aug 2026, ministry | same agency, different dates |
The ministry’s stated target for the North Aral is up to 27 km³ by 2030. That is a plan and not a measurement.
What this means if you want to see the Aral Sea
Standing water on the Kazakh side is at the North Aral: the data above show its volume holding while the southern basin shrank. For the practical side of a trip, see these pages:
- The Aral Sea in Kazakhstan: where it lies, the dam, how to reach it.
- Kyzylorda region: what else is nearby.
- Barsakelmes reserve: a former island in the sea.
- 200 places in Kazakhstan ranked by search demand: the Aral Sea leads the worldwide column.
The full series is one CSV file under CC BY 4.0, with a source link on every row.
Method and limits
We combined three series without adjusting them: Micklin’s area and volume (2010, Table 1, as cited by Conrad and Kobildjanova), Gaybullaev and co-authors’ runoff, volume and salinity (2012, Table 1), and North Aral figures from ministry statements carried by Kapital.kz and Zakon.kz. A script calculates the percentages and rates.
We measured interest in the topic separately. Those are search figures, and they say nothing about trips or the state of the sea. According to Ubersuggest on 6 November 2026, aral sea before and after gets 3,600 searches a month worldwide, aral sea today 720, aral sea then and now 210.
Frequently asked questions
How big was the Aral Sea before it shrank?
How much of the Aral Sea is left today?
Is the Aral Sea recovering?
Can I download the data?
Sources
- Conrad, Kobildjanova. The Economics of an Environmental Disaster: The Aral Sea (reproduces Micklin 2010, Table 1)
- Gaybullaev, Chen, Gaybullaev. Changes in water volume of the Aral Sea after 1960. Applied Water Science, 2012
- NASA Earth Observatory: The Shrinking Aral Sea Recovers
- Kapital.kz, 10 Feb 2025: North Aral volume and area, ministry data
- Zakon.kz, 10 Sept 2025: North Aral volume and 2030 plan
- Kapital.kz, 19 Aug 2026: North Aral volume, ministry data
- Ubersuggest: keyword overview, 6 Nov 2026
Read also
 Almaty in winter by numbers: smog, snow and cold days
 Direct flights to Kazakhstan: where they come from and how long they take
 Earthquakes in Almaty: 50 years of seismic data around the city
 Hotel occupancy in Kazakhstan by region and resort area, 2025–2026
 How foreign visitors spend money in Kazakhstan: survey data by country
 Kazakhstan vs Uzbekistan vs Kyrgyzstan: a data comparison for travellers